This is a introductory blog to help public understand the application of transportation modeling in industry under a big picture view, but will not include more details. It overall introduce 2 main models by different development objectives: planning and business. So they are using different technical approaches and methods to develop and apply models.
Reader could regard this blog as an index. For more details, please check reference list.

Why We Model Transportation
A model is a simplified version of real world. basically, it is a digital world trying to simulate the complex movement, activity, Phenomenon of nature and human society from real world. we use model to help understand better about our surroundings. Imagine building a “digital twin” of a city: a simplified, virtual version that simulates real-world movements—like traffic patterns, delivery routes, or commuter behavior. That’s what transportation models do. They help us answer questions like:
What if we build a new subway line?
How can we avoid traffic jams?
Where will ride-hailing demand spike in the next hour?
But no model can capture reality perfectly. We build models based on specific goals, and those goals decide what data we collect, what math we use, and how we train or simulate the model.
Model varies based on its objective. what mathematical models should be applied, what data inputs should be used in model, how to set up parameters and train models, all these questions are all based on what we need from the model.
Let’s say you want to:
Predict a traffic jam — you’ll need up-to-date traffic data and a model that reacts in real time.
Estimate how many passengers need a ride downtown — you’ll need demand data, time patterns, and perhaps weather or event info.
Explore how transit fares affect travel choices — you’ll focus on long-term behavior trends and simulate different policy scenarios.
These different goals lead to different modeling strategies. This blog introduces two main purposes of modeling—city planning and business decision-making—and how each uses different techniques, from classic statistical models to machine learning.
Two main purposes of modeling
Planning Model
Public agencies and city planners use transportation models to support long-term infrastructure and policy decisions. The goal here is to understand how people make travel decisions and how different factors—like transit prices, travel time, or land use—affect travel patterns. These models help answer questions such as: Should we build a new transit line? How will tolling a freeway affect traffic volumes?
Planning models prioritize transparency, interpretability, and the ability to test policy scenarios. They don’t need to operate in real time, but they must be reliable over the long run. Because of this, planners often use statistical models and simulation frameworks like the Four-Step Model or Activity-Based Models (ABM). These models may not be as precise as real-time machine learning systems, but they offer a better understanding of underlying causes and relationships.
Business model
Transportation models used by companies—like Uber, Amazon, or delivery fleets—are designed to maximize operational efficiency and profit. These models aim to predict demand, suggest efficient delivery routes, reduce travel time, and improve customer experience. Since decisions often need to be made in real time, these models require high accuracy, real-time updates, and flexibility.
To meet these demands, companies often rely on machine learning approaches, including advanced methods like Graph Neural Networks (GNNs) and Transformers. These models can process large amounts of dynamic data, such as GPS traces, traffic sensors, and weather updates, to make fast and accurate predictions. The downside is that these models may be less interpretable—businesses care more about performance than full transparency.
| Aspect | Business Modeling | Planning Modeling |
|---|---|---|
| Goal | Maximize profit and efficiency | Support long-term public decisions |
| Users | Private companies (e.g., Uber, Amazon) | Public agencies, urban planners |
| Requirements | Real-time, high accuracy, flexible updates | Transparent, interpretable, stable over time |
| Technical Methods | Machine learning (GNNs, Transformers, etc.) | Statistical models, 4-Step Model, ABM |
| Data Type | Dynamic, real-time GPS, traffic, user demand | Survey data, census, land use, network design |
| Update Frequency | Frequent (hourly or daily) | Occasional (monthly, yearly, scenario-based) |
| Model Transparency | Lower (black-box models) | Higher (clear assumptions and logic) |
In the next section, we’ll explore the common technical approaches for these two fields:
Planning Model – mathematical model
Demand network and Supply network
Transportation planning revolves around two core elements.
Demand: The travel needs and behaviors of individuals and households.
Supply: The transportation infrastructure available, including roads, transit systems, and other facilities.
Models like the Four-Step Model and ABM are tools used to simulate and analyze how these two elements interact, helping planners make informed decisions about infrastructure investments and policy implementations. In one sentence, models aim to explore how to plan supply network to satisfy travel demand under certain conditions.
ABM & 4 steps
Developed in the 1950s, the Four-Step Model is a sequential process that estimates travel demand and assigns it to the transportation network.1 This model treats trips as isolated events, focusing on aggregate flows rather than individual behaviors. The steps include:
Trip Generation: Estimating the number of trips originating and ending in different zones.
Trip Distribution: Determining where trips go, linking origins to destinations.
Mode Choice: Deciding which mode of transportation (car, bus, train, etc.) is used.
Traffic Assignment: Allocating trips to specific routes within the network.

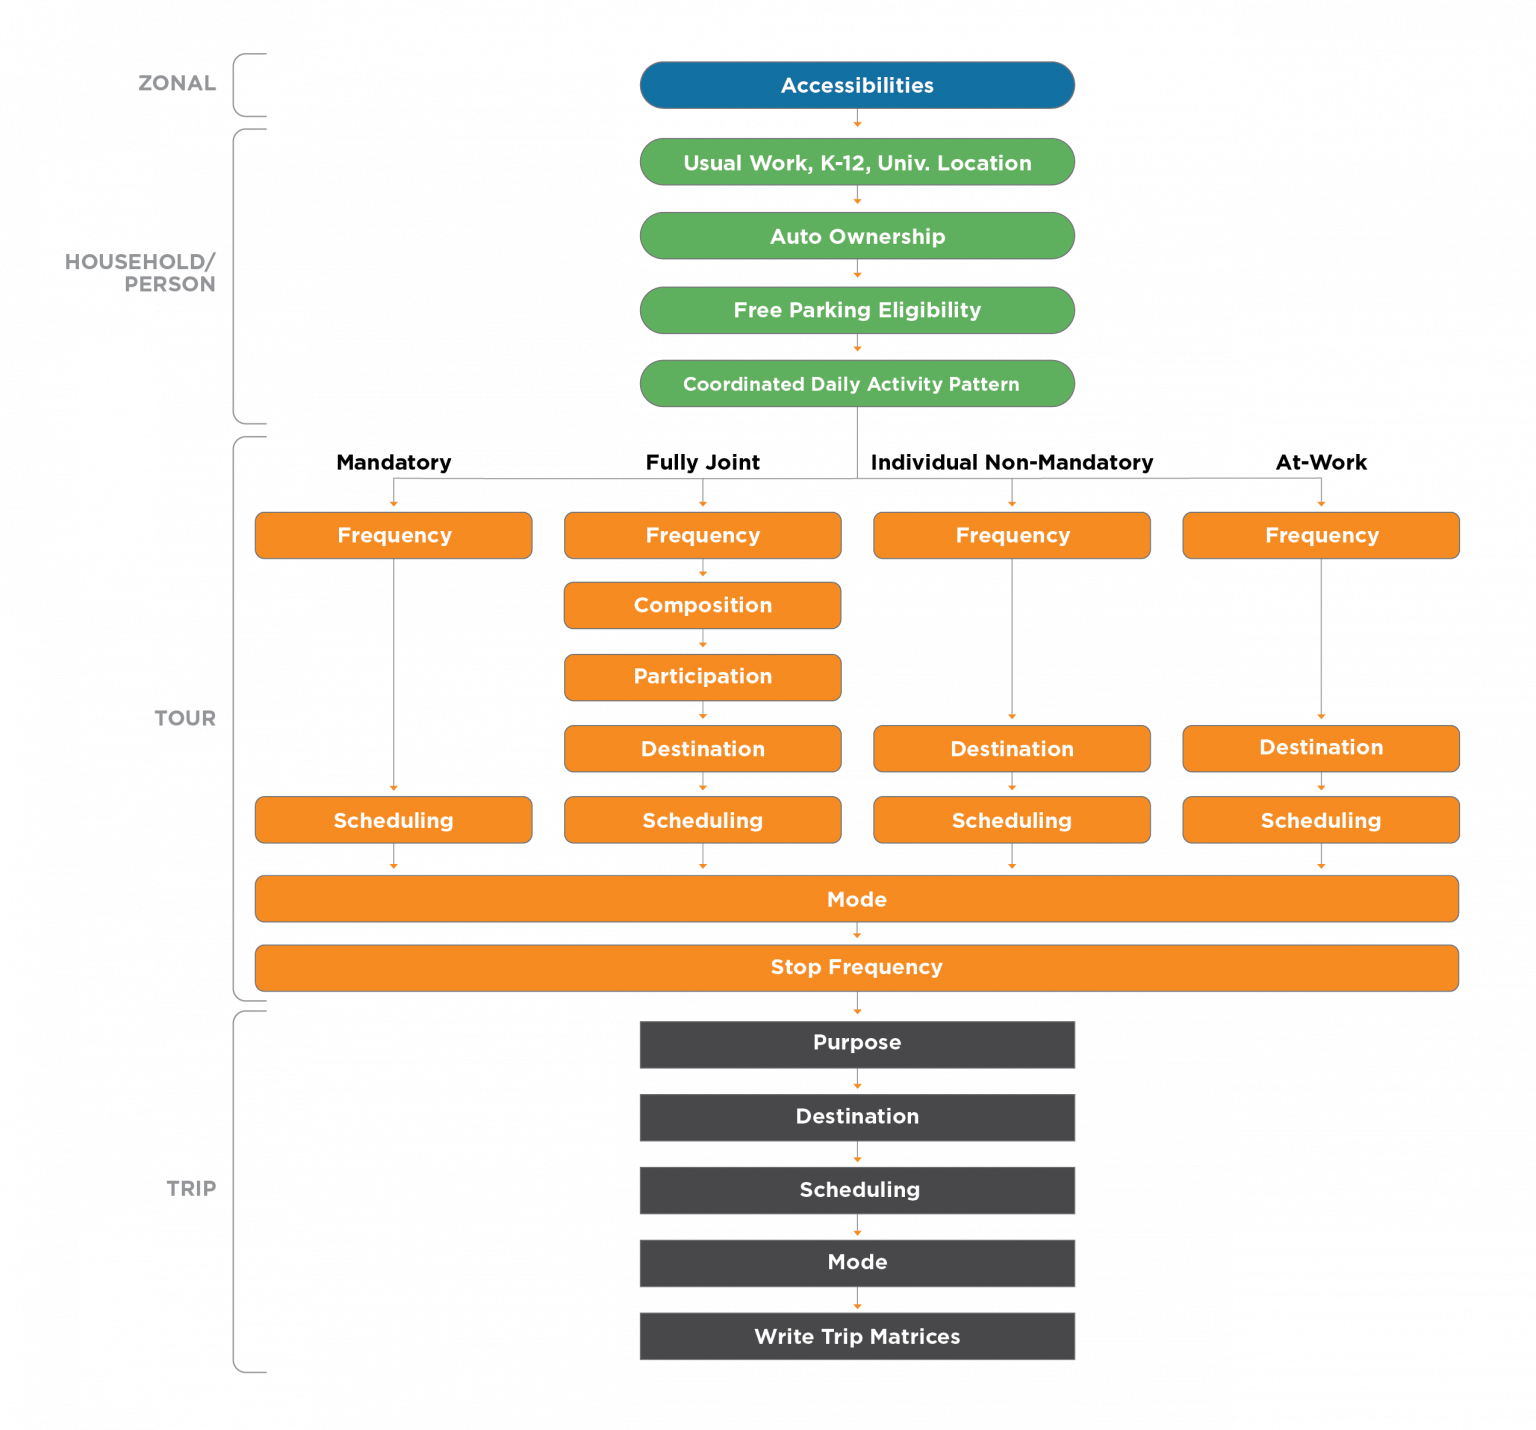
ABM takes a more detailed approach by simulating individual daily activities and travel behaviors. It considers:
Individual Schedules: Modeling the sequence of activities (work, shopping, school) for each person.
Household Interactions: Recognizing that household members coordinate activities and share resources.
Time and Space Constraints: Accounting for the timing and location of activities, leading to more realistic travel patterns.
By focusing on the underlying reasons for travel, ABM provides a nuanced understanding of demand and its interaction with the transportation supply.
Think of the Four-Step Model as a static photograph capturing the number of vehicles between two points during rush hour. In contrast, ABM is like a documentary film following individuals throughout their day, revealing the motivations and sequences behind each trip. ActivitySim is an open source activity-based modeling platform, used by MPOs like SANDAG and MTC.
Compare Four-step model and activity based model:
| Aspect | Four-Step Model | Activity-Based Model (ABM) |
|---|---|---|
| Demand Representation | Aggregate trips between zones. | Individual activity patterns and schedules. |
| Supply Interaction | Assigns trips to network based on volume. | Simulates individual routes considering time and mode. |
| Behavioral Detail | Limited; does not account for trip chaining. | High; includes trip chaining and activity dependencies. |
| Temporal Resolution | Often peak periods or daily totals. | Detailed time-of-day analysis. |
| Data Requirements | Less intensive; relies on zonal data. | High; requires detailed individual and household data. |
MPOs are regional agencies responsible for transportation planning in urbanized areas. Next blog will be introduction of Activity Based Model (ABM3 as example).
| MPO Name | Region Covered | Model Type | Notes |
|---|---|---|---|
| San Diego Association of Governments (SANDAG) | San Diego, CA | Activity-Based | Utilizes an advanced ABM for regional planning. |
| Metropolitan Transportation Commission (MTC) | San Francisco Bay Area, CA | Activity-Based | Employs ABM for detailed travel behavior analysis. |
| Metropolitan Washington COG (MWCOG) | Washington, D.C. | Gen2:Four-Step Gen3:ABM (developing) | Uses a traditional model but exploring ABM integration. |
| New York Metropolitan Transportation Council (NYMTC) | New York, NY | Activity/tour -Based | Implemented ABM for comprehensive planning. |
| North Central Texas Council of Governments (NCTCOG) | Dallas-Fort Worth, TX | Four-Step | Uses traditional model with enhancements; considering ABM adoption. |
Business Model – Machine Learning
When it comes to tech and logistics companies like Uber, Google, or Amazon, their goals are different from public agencies. While a public agency might focus on equity or long-term planning, these companies aim to deliver fast, efficient, and personalized services. They also have more flexibility in choosing advanced models—especially machine learning or deep learning—thanks to the massive amount of real-time data they collect from users.
That doesn’t mean every private company uses deep learning all the time. But some of the most well-known examples—like Uber and Google Maps—do use it to predict travel time and suggest the best routes. These companies have a clear advantage: millions of trips per day feed into their systems, creating a strong foundation for training deep learning models.
Why Deep Learning?
Deep learning is a type of machine learning that works a bit like our brains. It uses something called a neural network, which has many layers that help the model learn patterns in data. This makes it especially useful when we’re dealing with complex systems—like city traffic—where there might be thousands or even millions of factors influencing the outcome.

One big strength of deep learning is that it’s self-learning. You don’t need to manually program the logic. The model figures out its own rules directly from the data. This is called an end-to-end model—you give it the raw input (like the trip route and time of day), and it gives you the output (like Estimated Time of Arrival ETA), without needing to define each step in between.
But this also creates a key difference from traditional models like Activity-Based Models (ABM). ABMs are designed by humans, and each part of the model—like whether someone owns a car, chooses to walk, or decides to make a trip—has clear real-world meaning. You can track every decision the model makes, and it’s easier to explain.
Deep learning doesn’t work that way. The “middle layers” in a neural network don’t represent ownership, income, or mode choice. Instead, they are just abstract mathematical representations learned from data. The model might be accurate, but we don’t always know why it made a specific prediction. Statistic model like ABM is a transparent house that you can see it is structured from manually designed units. On the opposite, deep learning is a black box.
For companies like Uber and Google, this trade-off is acceptable. They have access to massive amounts of high-quality user data, and they don’t need to explain every step to the public. This allows them to train end-to-end models, where the system learns everything from start to finish—predicting the best route or arrival time without breaking it into smaller pieces.
In short, deep learning is a strong choice when:
the system is complex,
lots of high-quality data is available,
and the focus is on accuracy rather than transparency.
That’s why it fits well with the goals of tech companies.
Uber DeepETA
Uber’s DeepETA model is designed to improve the accuracy of ETA for ride and delivery requests. While traditional ETA systems rely on routing engines and traffic maps to estimate travel time, this basic approach often misses real-world variability—like pickup delays, trip type, or neighborhood-specific traffic patterns. That’s where ETA post-processing comes in.2

In the system diagram above, the process begins with data from traffic conditions and maps, which is fed into a routing engine. The routing engine calculates a base ETA, just like any navigation app would. But instead of sending this estimate directly to the user, Uber adds a machine learning (ML) model on top of it.
This ML model acts as a smart filter. It receives the trip’s origin, destination, traffic, time of day, and whether it’s a ride share or delivery. Using millions of past trips, it learns how real travel time often differs from the base estimate and adjusts it accordingly. This step—called ETA post-processing—is fast, accurate, and critical for Uber’s operations. It improves the user experience by reducing errors in ETA, especially during peak hours or in complex urban environments.
The core model uses a Transformer-based architecture with self-attention, allowing it to find meaningful patterns across spatial and temporal features. It also embeds map locations into multi-resolution grids and uses feature hashing to handle large geospatial datasets efficiently.
By using post-processing, Uber turns a generic route estimate into a finely tuned prediction—helping users trust the ETA and the service behind it.
Google use GGN to improve traffic prediction
Google Maps traffic prediction system consists of the following components: (1) a route analyser that processes terabytes of traffic information to construct Supersegments and (2) a novel Graph Neural Network model, which is optimised with multiple objectives and predicts the travel time for each Supersegment.3

Think of a city’s road network like a big web or map. In Google’s model:
Each road segment (a stretch between two intersections) is a dot (node).
If two segments are connected (like they touch at an intersection), they’re linked by a line (edge).
The GNN looks at all these dots and lines and learns how traffic flows by sharing information between nearby roads. This process is called message passing — like roads “talking” to each other to figure out where traffic might build up. The model learns from patterns like “if one road is busy, the next one might get crowded too.”
But cities have thousands of roads, and it’s too slow to process the entire network all at once. So Google breaks the network into smaller pieces called Supersegments. Think of a Supersegment as a mini road network — a group of connected road segments, or nodes, usually from areas with heavy traffic. These Supersegments are the input data for training the GNN. By training on many of these Supersegments, the GNN learns how traffic flows in different situations — and can then apply that knowledge to predict traffic across the entire city.