California races toward 100% zero-emission vehicle (ZEV) sales by 2035, bolstered by state and federal incentives like AB 2565 and the Infrastructure Investment and Jobs Act. Charging infrastructure must keep pace. But are all Californians poised to benefit equally?
The Current Landscape: Inequality in Access
California leads with over 80,000 public chargers statewide. Yet, a 2025 study revealed that charging infrastructure is disproportionately clumped in higher-income, whiter neighborhoods1. This quandary isn’t just academic: “income inequality in EV charger access is now three times that of gas stations”. Minority and low-income communities, already saddled with higher air pollution, often live in “charging deserts” where public infrastructure is scarce.
Meanwhile, the shift to build more DC fast chargers (DCFC) relative to Level‑2 units adds complexity. SCAG research found California’s charger network still heavily leans on Level‑2, with only 3% fast units.2 As Californians increasingly travel beyond local areas, lack of fast chargers limits both convenience and EV adoption.
On the ground, EV owners report frustrations in public charging: broken stations, long queues, waiting disputes—the infrastructure is expanding, but reliability lags behind. Even in EV-rich urban centers like LA and SF, charging deserts persist, a stark reminder that adoption doesn’t guarantee equitable access.3
Our Case Study Research In SF
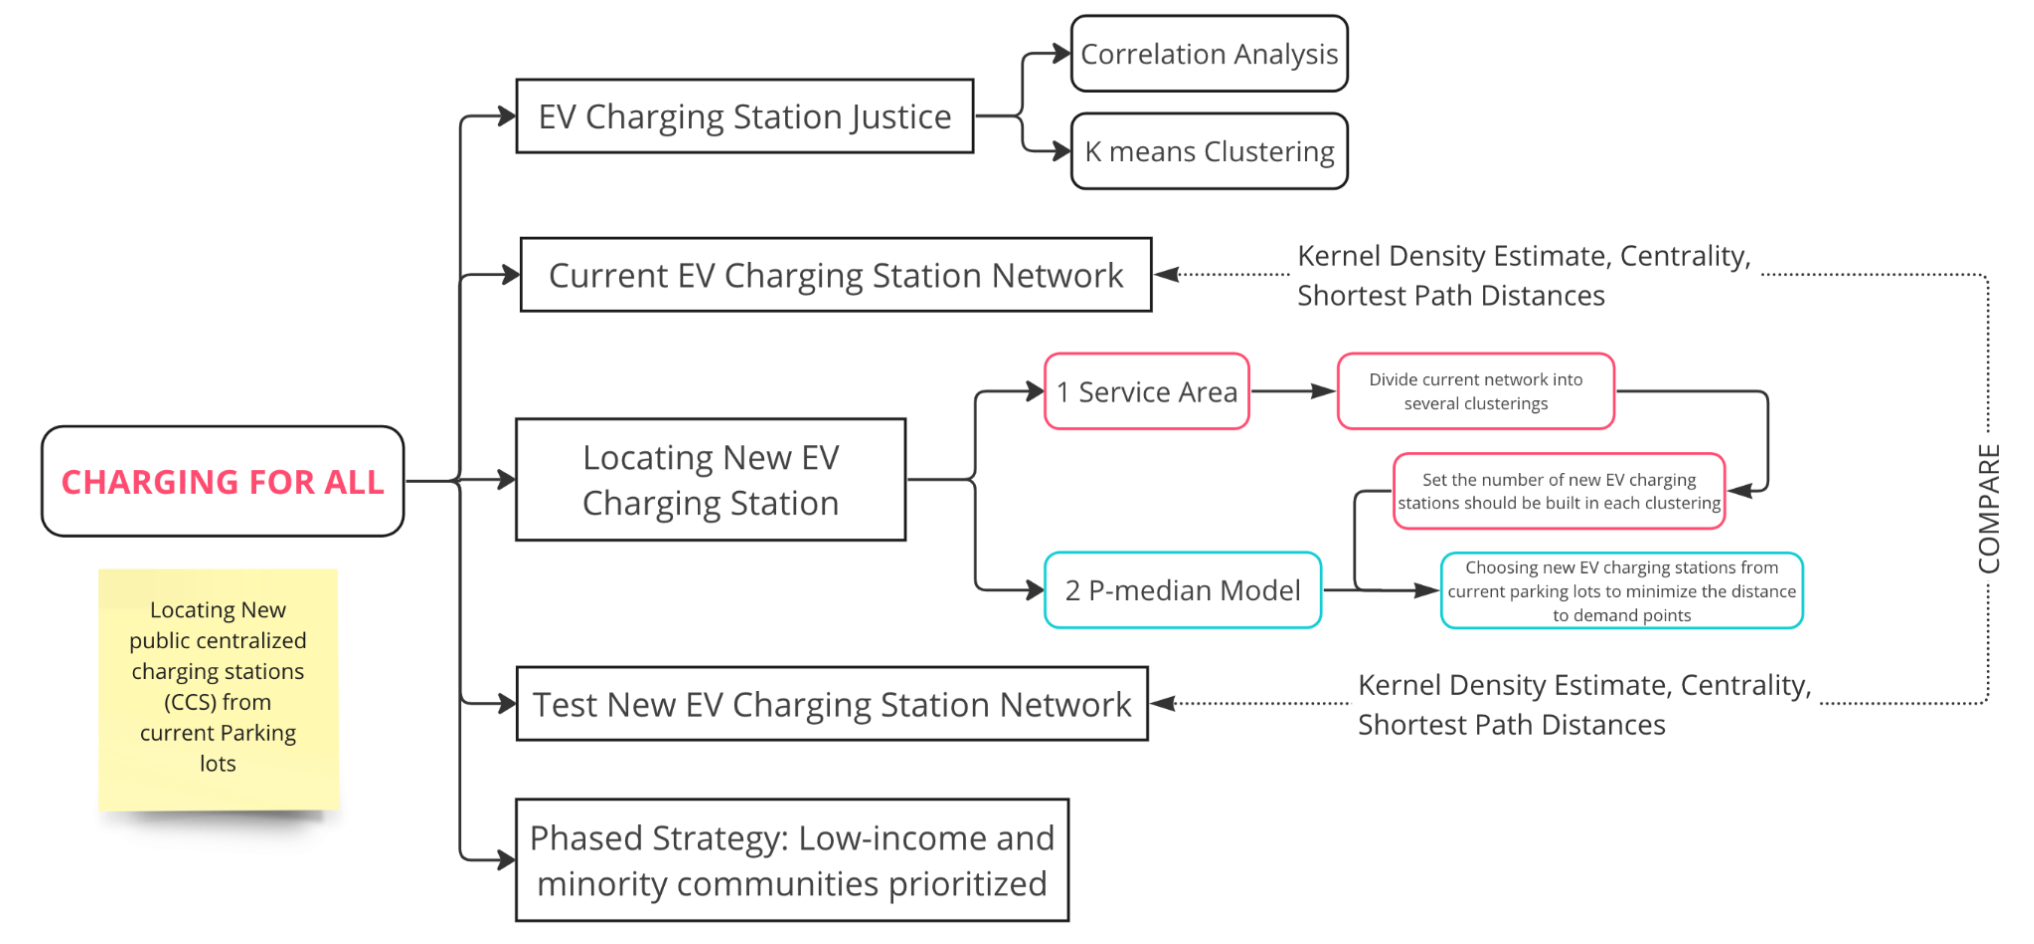 Fig 1. Study Framework
(This study research is based on 2022 data)
A. Equity Assessment Data gathering: We mapped existing station locations in relation to census demographics—income, race, vehicle ownership, commute patterns.
Analysis: Bivariate correlations and K‑means clustering quantify disparities. Initial results showed mild positive relationships between station density, white populations, and vehicle ownership—but overall station distribution lacks broader equity.
B. Network Analysis Spatial modeling: Using Kernel Density Estimation (KDE) and service area mapping, we highlighted coverage gaps. Areas beyond approx. 3 km from a charger—particularly in low-income tracts—stood out.
Centrality & connectivity: Betweenness and closeness centrality analysis from NetworkX uncovers isolated nodes and detects poorly connected neighborhoods—vulnerable zones that risk exclusion as adoption scales.
C. Strategic Site Optimization Clustering candidates: We viewed existing parking lots as potential sites, organizing them by charging station-to-parking-lot ratios within clusters.
P‑Median Model: A logistics model that places p facilities to minimize weighted travel distances to demand points. We chose to add 121 new stations, optimizing their locations to reduce distance gaps while consciously incorporating equity.
Phasing based on income: Finally, we overlaid new locations over low-income census tracts—in effect prioritizing 12 stations in underserved areas immediately.
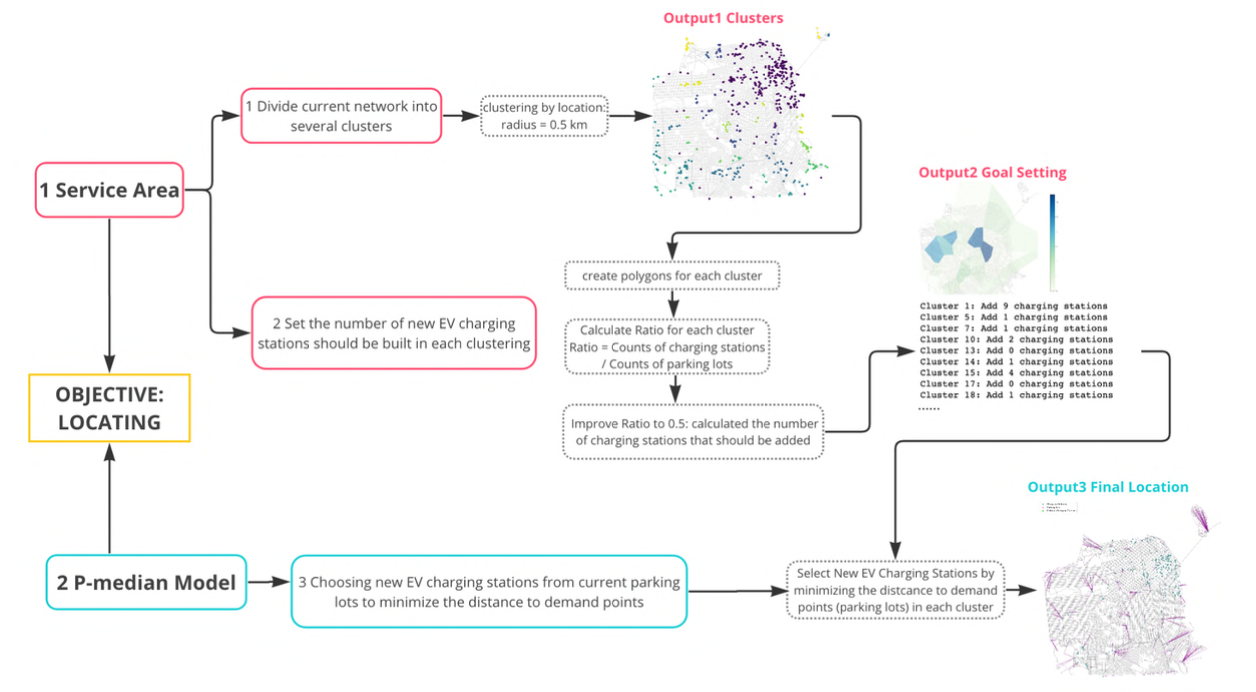 Fig 2. Mind Map for service area calculation and p-median model
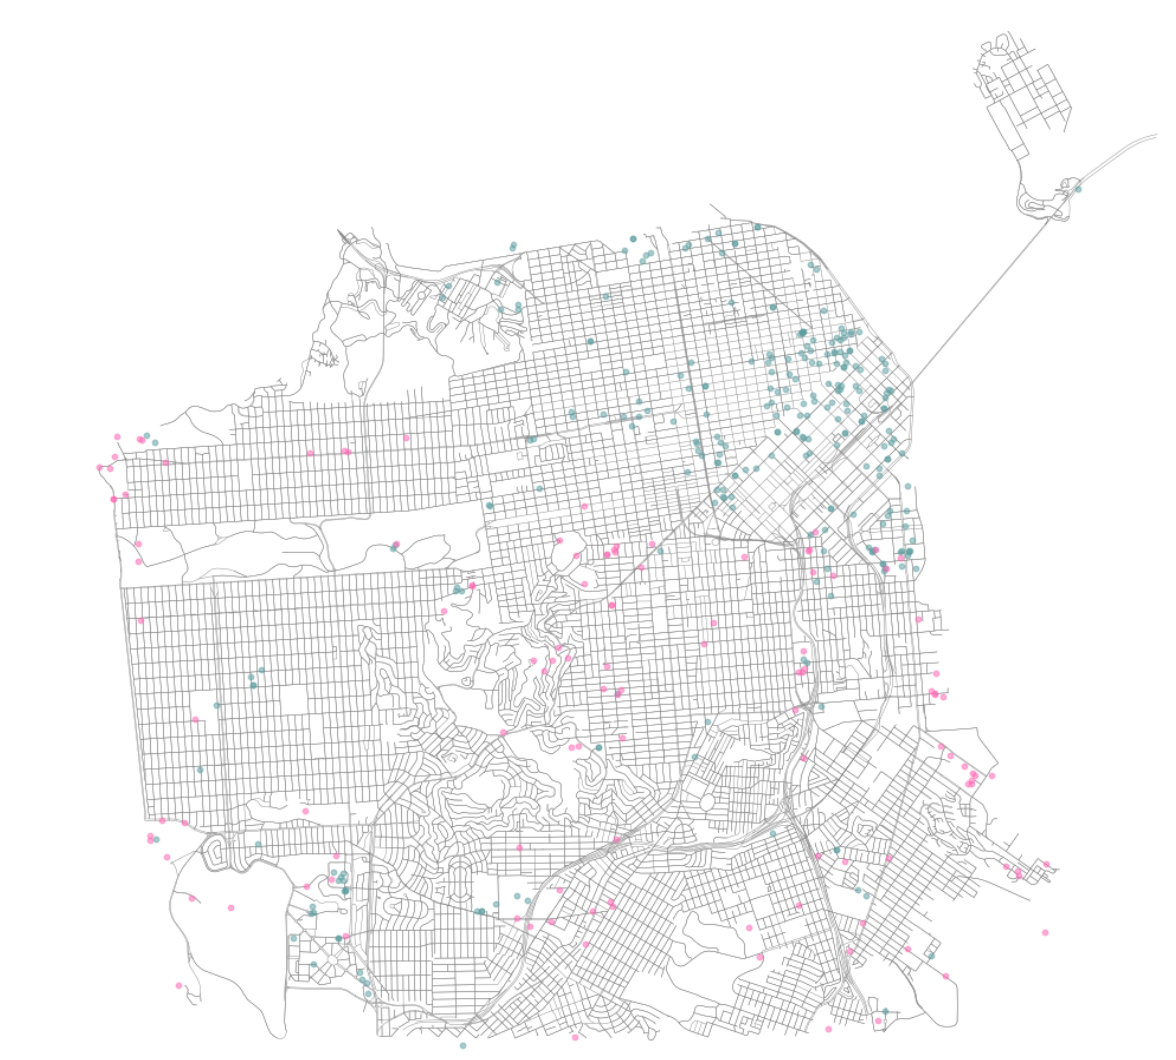 Fig 3. New EV stations (pink points)
Reflections on the Model & Findings
A. Strengths Data closed-loop: Linking socio-demographic data with fine-grained network metrics ensures a truly targeted equity analysis—not just anecdotal claims.
Optimization meets justice: The P‑median model doesn’t just add chargers—it strategically places them where they matter most, in line with infrastructure justice goals.
B. Caveats Demand proxies: We used parking-lot density as a stand-in for charging demand—but this may skew toward vehicle-centric areas. Renters, transit-dependent populations, or shared-community residents aren’t counted fully.
Grid readiness: Our siting neglected utility constraints. For instance, CPUC records show energization is often delayed by 125+ days due to grid upgrades. This issue could stall community-focused feeders, especially where utilities deprioritize low-income tracts.
Fast vs slow chargers: Our model treats chargers as interchangeable. California’s shift to DCFC—low quantity but high importance—suggests a need to differentiate charger types in future modeling.